Showing posts with label world indices. Show all posts

World Indices: DJI - Downtrend Channel Negated


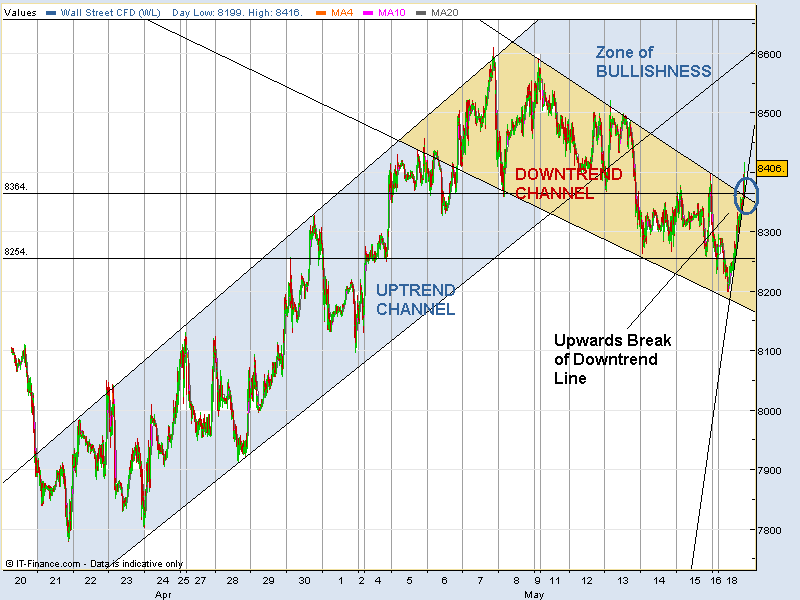
Interestingly, DOW has broken out of its recent downtrend channel on the 5-minutes interval chart as of 9:30pm. The index has entered into a Zone of Bullishness and is expected to test the resistance provided by the previous recent high at 8500 over the next few days.

Market Outlook: 18 May - 22 May


DOW

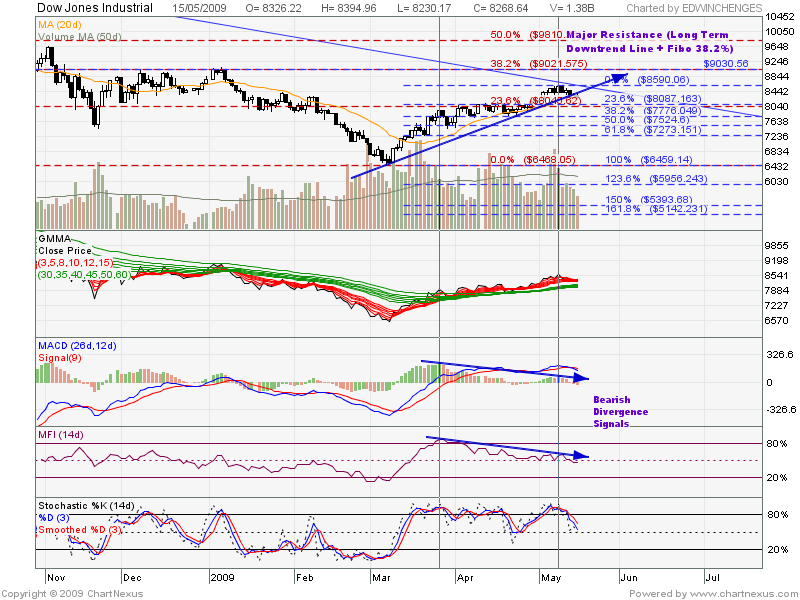
As anticipated previously, the long term Downtrend Line for DOW is holding quite nicely. DOW was seen retracing with a red bar on the 11 May 2009. Should this resistance fall, the next resistance thereafter will be around 9020 (Long term Fibo 38.2% Resistance), which conflux with Major horizontal resistance at 9030.

At the present moment, DOW is resting precariously on the 20-Days Moving Average. The closing on last Friday has seen the index breaking out and violating the current Uptrend Line. Should the 20-Day Moving Average and Psychological Support of 8000 fail to hold, we would probably see a fresh bout of selling down. In fact, bearish divergences are seen on the MacD, MFI and Stochastics.


Important Levels to Look Out for:

Confirmation of Bullish Trend to continue:

  • Price rebounding from 20-Days Moving Average (MacD Histogram showing 4r1g signal)

Confirmation of Bearishness:

  • Price breaks out of 20-Days Moving Average
  • Price breaks Psychological Support 8000 points

*Let's observe if the old adage of "Sell in May and Go Away" will come into fruition.


STI

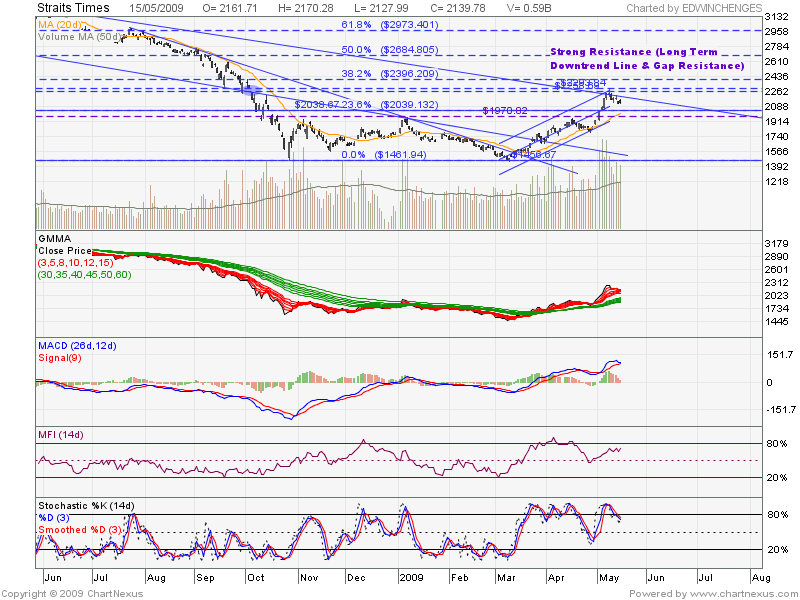
We observe a similar pattern for the Straits Times Index, where the price was resisted by the Long term Downtrend Line on 11 May as well. The gap resistance at 2260 - 2290 was closed as well, and price is currently seen retracing from these levels. The next level of resistance will be at around 2400 (Long Term Fibo 38.2% Fibo Resistance). Price is currently seen closed with a black candle from last trading session but is slighly higher than Thur's session. Using a short term Fibo retracement, this confluxs with a Short-Term Fibo 38.2%.

Important Levels to look out for:

Confirmation of BULLISHNESS:


  • Price breaking out of Downtrend Line
  • Price rebounding from 20-Days Moving Average
  • Price rebounding from Major Resistance turned Support 1970
  • + MacD histogram (4r1g) signals at these levels

Confirmation of BEARISHNESS

  • Price breaking below 1970

World Indices (For Week: 6 Apr ~ 10 Apr)

DOW JONES INDUSTRIAL

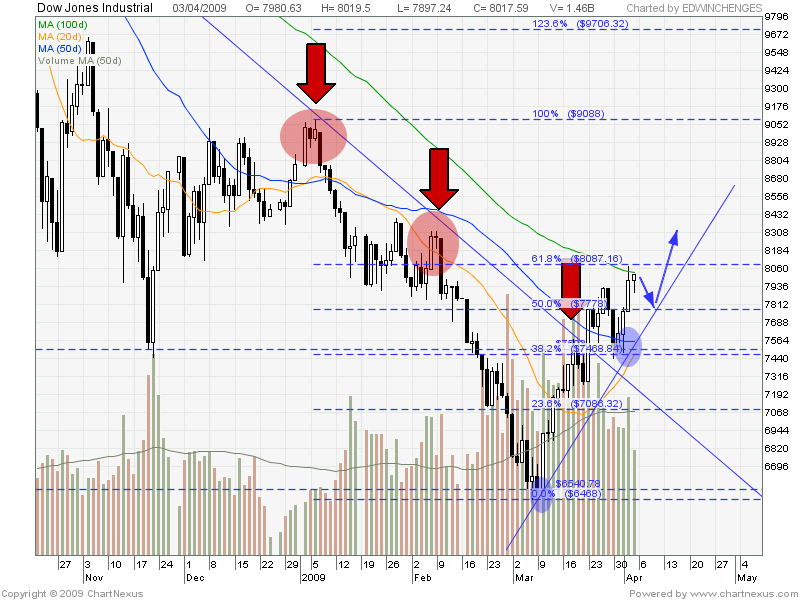
This week has been a rather bullish week for DJI. As previously anticipated, the Fibo 38.2% + Resistance turned Support levels (7468 to 7500) is holding out quite well and price has currently broken out of Fibo 50% (7778). Based on closing from last Friday (3 Apr), the price is currently resisted by Fibo 61.8% (8087) and 100-Day Moving Average. A white hanging man formation is also observed which indicates a possible slight retracement to Fibo 50% (7778) and Uptrend line, before resuming its bullish run.

The real test for DJI will be the slew of coporate earnings which will be released this week. Should the market not react favourably and the Fibo 50% + Uptrend line fails to hold, a SHORT position may be opened.


HANG SENG INDEX

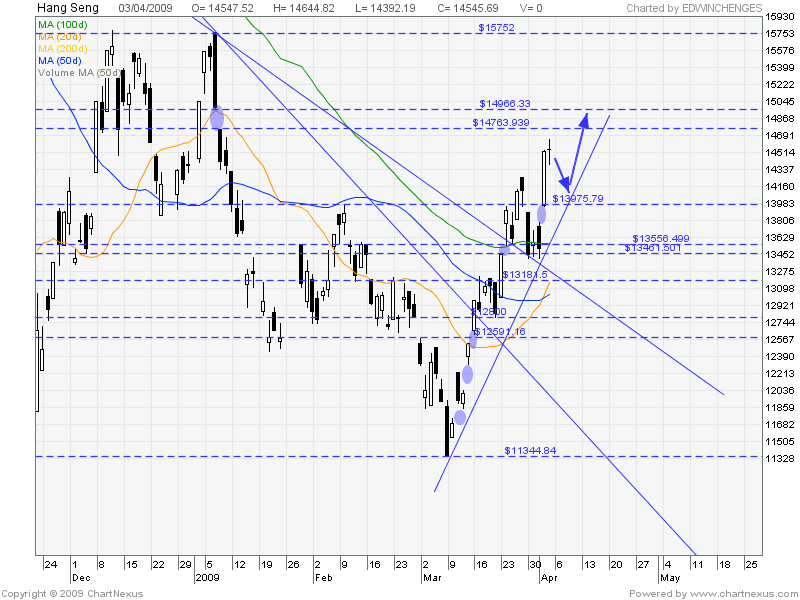
For the Hong Kong market, HSI has staged a rather impressive run for this week too. Notice the multiple Rising Window Supports which are currently holding the price up. This indicates the powerful momentum of the stock. The price closed with a doji on last Friday, which indicates a deliberation (either a pause for retracement before resuming bullish trend upwards OR a reversal of bullish sentiments). Scenario 1 seems to be more likely at this point in time as I anticipate the stock price to take a short dip towards the upper limit of recent gap support (13975) and bounce off from Uptrend Support Line to test gap resistance (14763 - 14966).


STRAITS TIMES INDEX
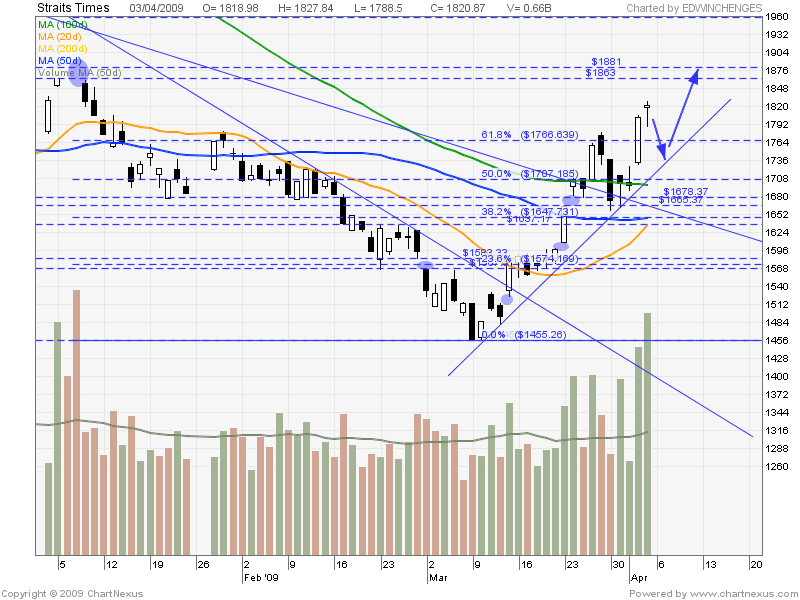
We see a similar note for somewhere closer to home. STI closed on last Friday with a variant of a white hanging man formation as well. A possible retracement to support at uptrend line will be healthy at this point of time before resuming its bullish streak to test the gap resistance (1863 - 1881).


In a nutshell: So what is the cue that we can take from all these indices? The market is extremely volatile these days, should one decide to take a position, they have to be relatively nimble and lock in any profits quickly. Should one take a LONG position on rebound from critical supports? - Maybe, but do note that all technical indicators are currently in OVERBOUGHT region. Though classical analysis takes precedence over technical indicators, the recent 'rally' is, in my opinion, too fast and furious.

A safer bet would be to wait for the price to break out of the current Uptrend Support Line and enter with a SHORT position as we are still technically in a bear market.
Copyright © 2009 - Chart Guru - is proudly powered by Blogger
Smashing Magazine - Design Disease - Blog and Web - Dilectio Blogger Template