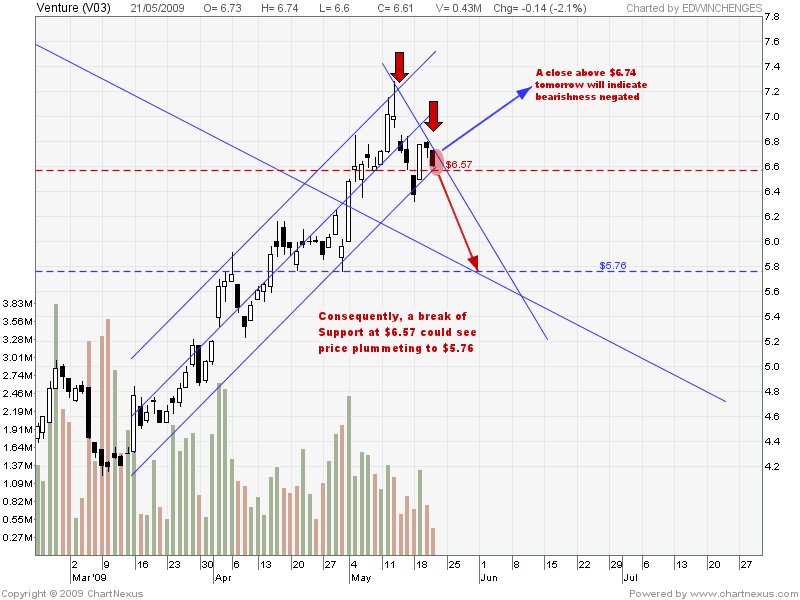
Interesting day today with many counters breaking 20-Day MA. Bank counters also showing signs of weaknesses with DBS breaching the Resistance turned Support level.
Below is the list of counters of stocks breaking 20-DMA today:
No. Stock Name Triggerred Date Triggerred Rules
1 ASL Marine 8 Jun 2009 ((Price touching MA))
2 Biosensors 8 Jun 2009 ((Price touching MA))
3 Broadway 8 Jun 2009 ((Price touching MA))
4 CH Offshore 8 Jun 2009 ((Price touching MA))
5 China XLX 8 Jun 2009 ((Price touching MA))
6 ChinaAOil 8 Jun 2009 ((Price touching MA))
7 ChinaFish 8 Jun 2009 ((Price touching MA))
8 ComfortDelGro 8 Jun 2009 ((Price touching MA))
9 CSE Global 8 Jun 2009 ((Price touching MA))
10 Ezra 8 Jun 2009 ((Price touching MA))
11 F & N 8 Jun 2009 ((Price touching MA))
12 FIRST RESOURCES LIMITED 8 Jun 2009 ((Price touching MA))
13 Golden Agri 8 Jun 2009 ((Price touching MA))
14 Goodpack 8 Jun 2009 ((Price touching MA))
15 IndoAgri 8 Jun 2009 ((Price touching MA))
16 KepCorp 8 Jun 2009 ((Price touching MA))
17 Longcheer 8 Jun 2009 ((Price touching MA))
18 M1 8 Jun 2009 ((Price touching MA))
19 MacqIntInfra 8 Jun 2009 ((Price touching MA))
20 MERMAID MARITIME PUBLIC CO LTD 8 Jun 2009 ((Price touching MA))
21 Midas 8 Jun 2009 ((Price touching MA))
22 Rotary 8 Jun 2009 ((Price touching MA))
23 SembCorp 8 Jun 2009 ((Price touching MA))
24 ST Engg 8 Jun 2009 ((Price touching MA))
25 StamfordLd 8 Jun 2009 ((Price touching MA))
26 StarHub 8 Jun 2009 ((Price touching MA))
27 Swiber 8 Jun 2009 ((Price touching MA))
28 Swissco 8 Jun 2009 ((Price touching MA))
29 TechOil&Gas 8 Jun 2009 ((Price touching MA))
30 Wing Tai 8 Jun 2009 ((Price touching MA))
SGX: Stock Watch for 19 May (Kepcorp & SGX)
Posted by Edwin Edangelus Cheng Labels: SGX, Stock WatchKepcorp
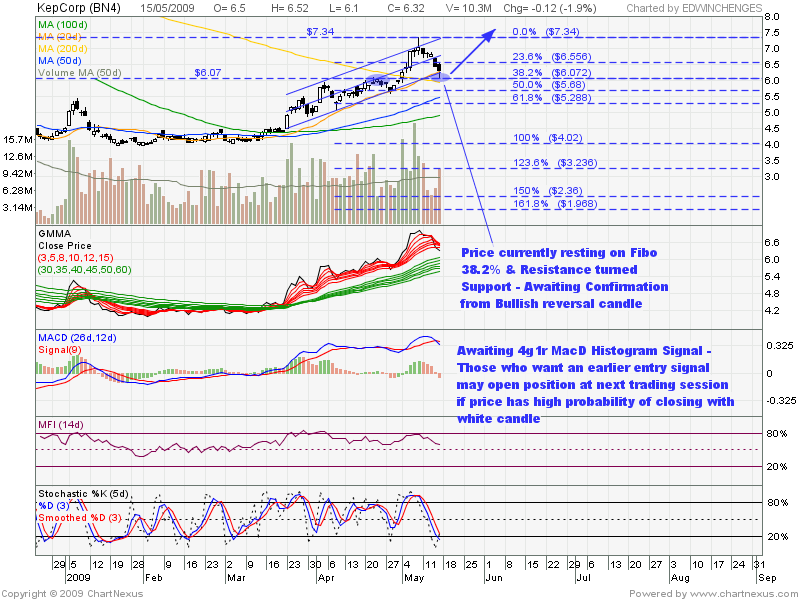
The current uptrend support line is holding up well. Stock closed marginally with a white candlestick today. Currently still awaiting a 4r1g MacD histogram signal.
- Action to take: Good for a LONG trade if stock trades and has a possibility of closing above $6.31 (20-Days Moving Average) and above previous session's high of $6.32.
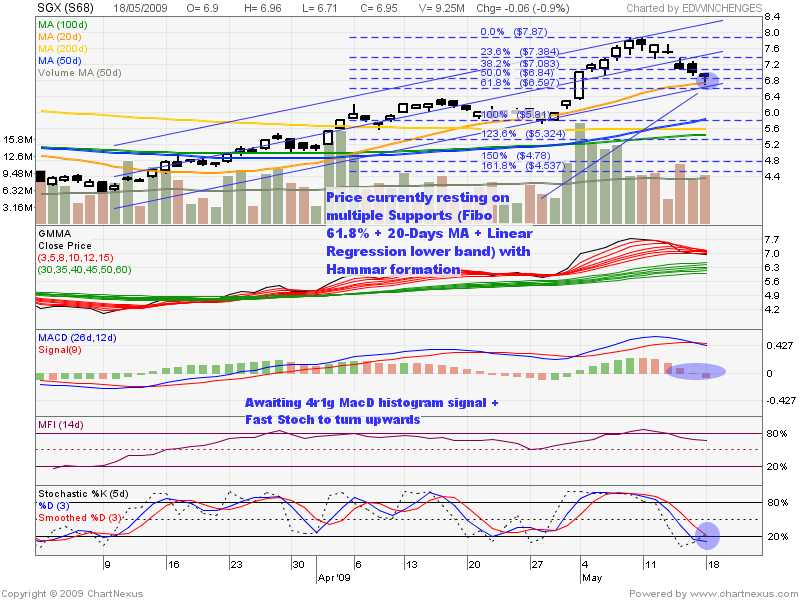
SGX
Another stock which caught my attention today is SGX. Currently resting on a conflux of multiple support levels. Watch out for a Gap Resistance at 7.32 to 7.48.
- Action to take: Good for a LONG trade if stock trades above $7.02 (Fibo 38.2% Resistance)
*Caveat emptor - All usual disclaimers apply.
Trades are valid only for a short term time frame
Stock watch for monitoring for next trading session. In order of preference:
- SIA
- Kepcorp
- Olam
*Caveat emptor - All usual disclaimers apply. Trades are valid only for a short term time frame
Market showing signs of retracement today.
Several counters are retracing from their previous session's high.
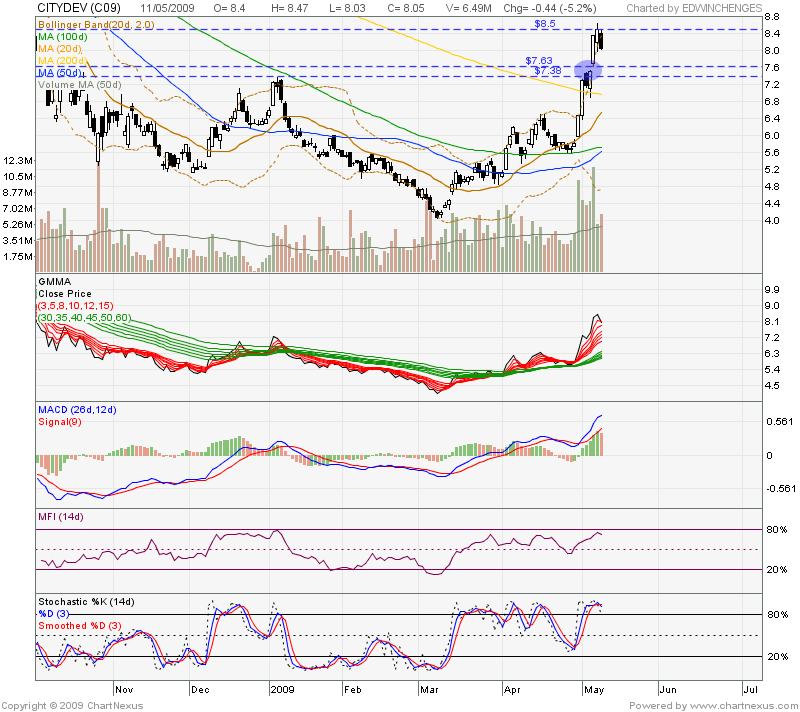
Managed to filter out CityDev using CT1 SHORT signals.
Entry: 8.04 (1 bid below previous close)
Stop loss: 8.64 (1 bid above recent high)
Profit: 7.38 ~ 7.63 (gap support conflux with horizontal support)
Those who are interested in shorting may consider this counter. Do note however that this is a counter trend strategy i.e. you will be assuming a greater degree of risk as you are working against the prevailing trend.
*Caveat emptor - All usual disclaimers apply.
Trades are valid only for a short term time frame
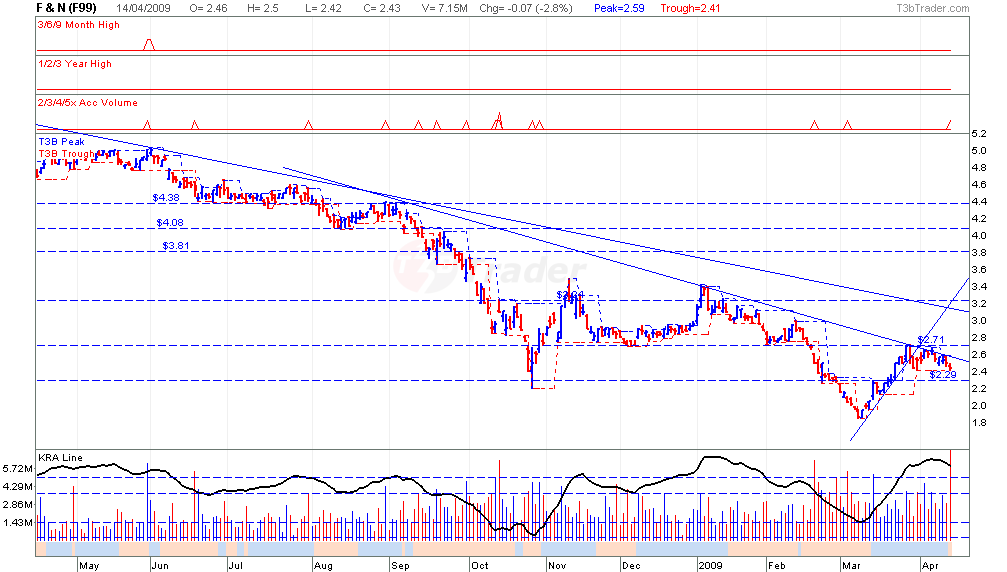
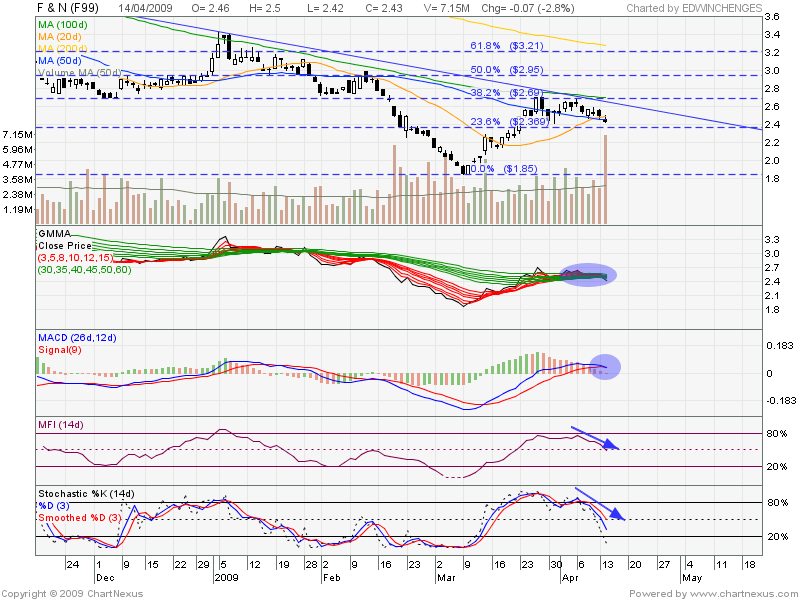
T3B Strategy: F & N is poised for a S2M2 breakout. Conflux of resistances provided by downtrend line and peak. K-line is currently around level 9.
Technical Analysis: We can see a cross-over signal for both MacD and GMMA signal as well. MFI and Stochastics show bearish signals as well.
Entry (E): 2.40 (1 bid below trough)
Stop Loss (S): 2.60 (1 bid above peak)
Profit (P): 2.13 (approximation)
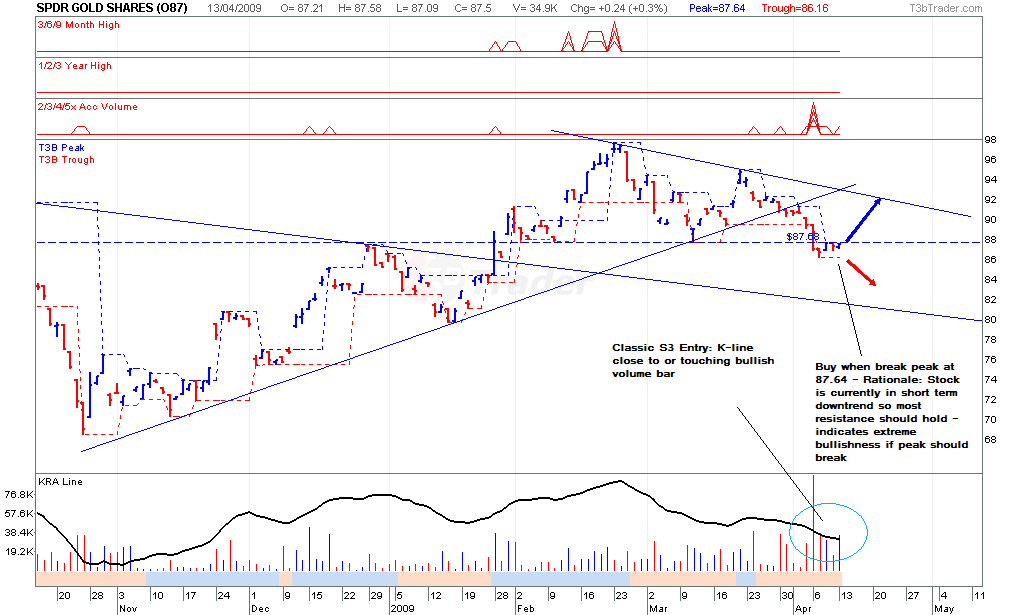
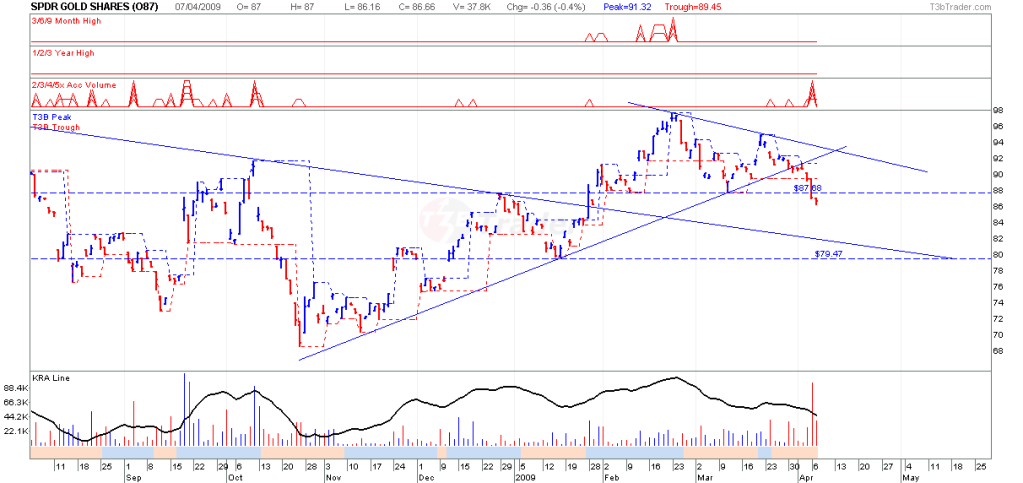
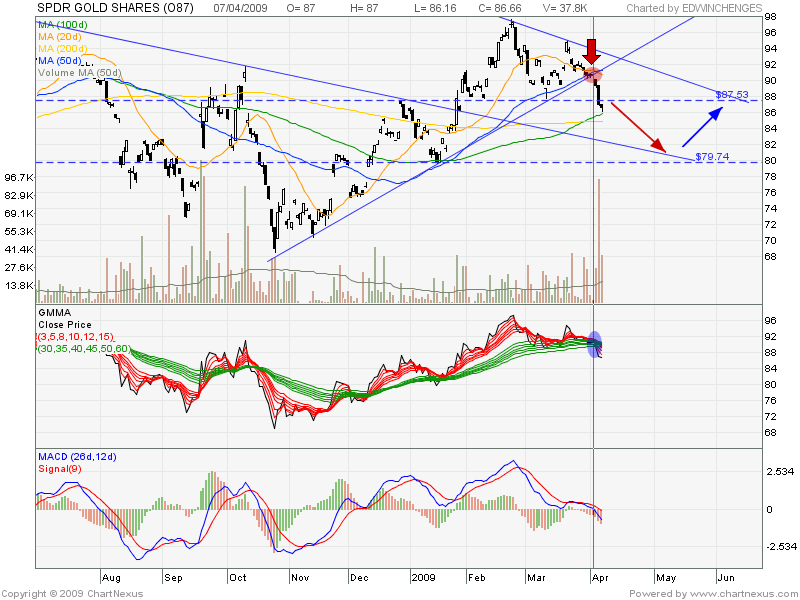
Was monitoring SPDR Gold Shares for the past few trading sessions. Noticed a suitable entry point to LONG for tomorrow. The stock is currently trading in a tight peak and trough range (Peak: 87.64 and Trough: 86.16). Two possible scenarios may happen: 1. Stock breaks trough (no position taken - await for another suitable entry for LONG) or 2. Stock breaks peak
Using Classical S3 entry, the K-line is currently touching the bullish volume bar, which indicates a possible reversal point. The rationale for this trade is as such, the stock is currently downtrending, which means that the chances of a trough breaking is much higher than a peak. Should the stock break the peak, this would indicate a change in sentiments and thus, a translation into a high probability trade.
One may ask why would we want to LONG a downtrending stock? - Answer: there is a possible rebound back to the downtrend line before the stock would resume its downtrend again; this is otherwise known as a Counter Trend strategy. If the above scenario comes into fruition, a lower high would be formed. For those who are acquainted with Technical Analysis, you would have notice the prices resting on 100-Day Moving Average for the past few trading sessions.
If you are interested in trading the counter, you may find it under POEMS CFD or DMA --> look for GLD 10 US$.